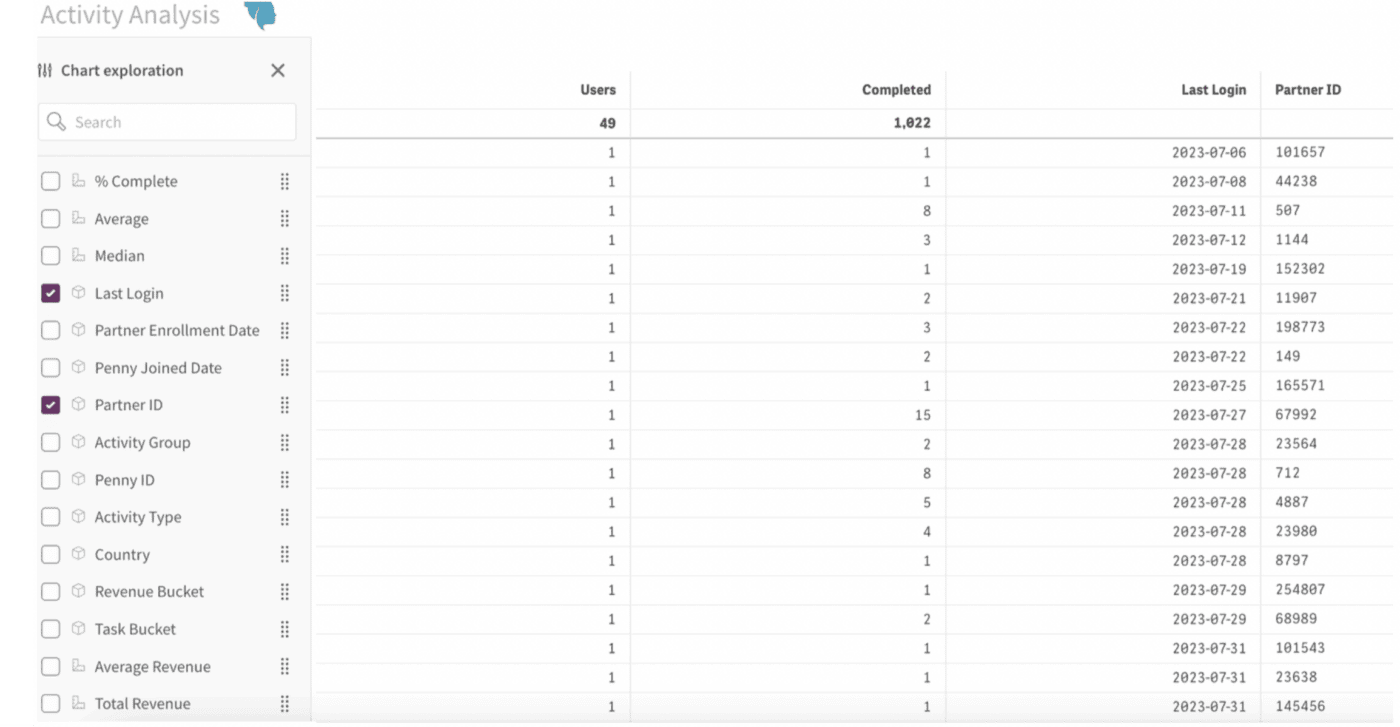
The Activity Analysis App
Activity Analysis Overview
The Activity Analysis app is where all your user Penny activity data lives. It includes:
- Tasks (actual Penny tasks, such as a
Reach Outor aFollow-up) - Adding new prospects, customers and downline team members
- Number of sales orders and the total value (gross) of those orders
- Note it only includes the past year of data
The main sheet, Activity Analysis is fully customizable table with several filters. The table is designed to be very flexible so you can find the exact information you’re looking for.
The two charts at the bottom of this main sheet show activity volumes and distribution by activity type (you can swap views to show by day, month, quarter etc).
This sheet is where you can create a report of, for example, the number of tasks completed in a given Power Week challenge.
The second sheet Comparative Analysis, has the same functionality as the Activity Analysis sheet, but now you can compare and contrast two different data sets. This sheet can be used in a variety of ways, including:
- Activity (task, orders, etc.) before or after a training
- Compare one month to another (same month last year? the month previous? before and after a specific challenge?)
Video Examples:
How do I find the number of tasks someone completed during a specific time period?
Step 1: Go to the Activity Analysis
Step 2: Select Tasks Only > Y
Step 3: Select your date period under Completed Date.
Step 4: Use the Chart exploration to select the fields you’d like to view.
