The User Summary App
User Summary Overview
The User Summary app is where you look for information about the numbers of total, active and churned users.
The main sheet, User Summary contains a table and 2 graph views of the new (joined), churned users and active user trends over time (you can change the time dimension to day, week, month, quarter or year as necessary).
The sheet is an overview and looks at trends over time. If you are looking for more specific data or reports, those numbers should be gather from other of the other sheets described below.
The Deep-Dive sheet is where you’ll most often want to pull reports. By using the various date filters, you can see the numbers for new (joined), active (logged in) or enrollments (joined the partner) by various date ranges.
The Comparative Analysis sheet is for comparing users and should be used when you want to look at the numbers of joined, active or enrolled users before and after a specific date, or when you’d like to compare numbers in one time period to another. ***
The User-Level Data sheet will give specific lists at the user-level. Use this sheet when you want a list of specific users. If you've applied filters to the other sheets, excluding Comparative Analysis, which is a special case, you can switch to this sheet to see the list of users included in your filters.
How do I find out how many active users we have?
Determining how many users are active depends on whether you define active as having logged in within the previous 30 days (and you want to know how many users were active as of June 1, for example), or whether you determine active based on who actually logged into Penny during a given time period.
For an overview of the difference and how to find the various numbers, see the video below.
How do I see how many users joined Penny last month?
To see the numbers of users that have joined Penny in a given time period:
- Find the
Deep-Divesheet in theUser Summaryapp - Filter by the
Penny Joined Datefield

How do I see how the number of users I’m being billed for each month and who logged into the app during each month?
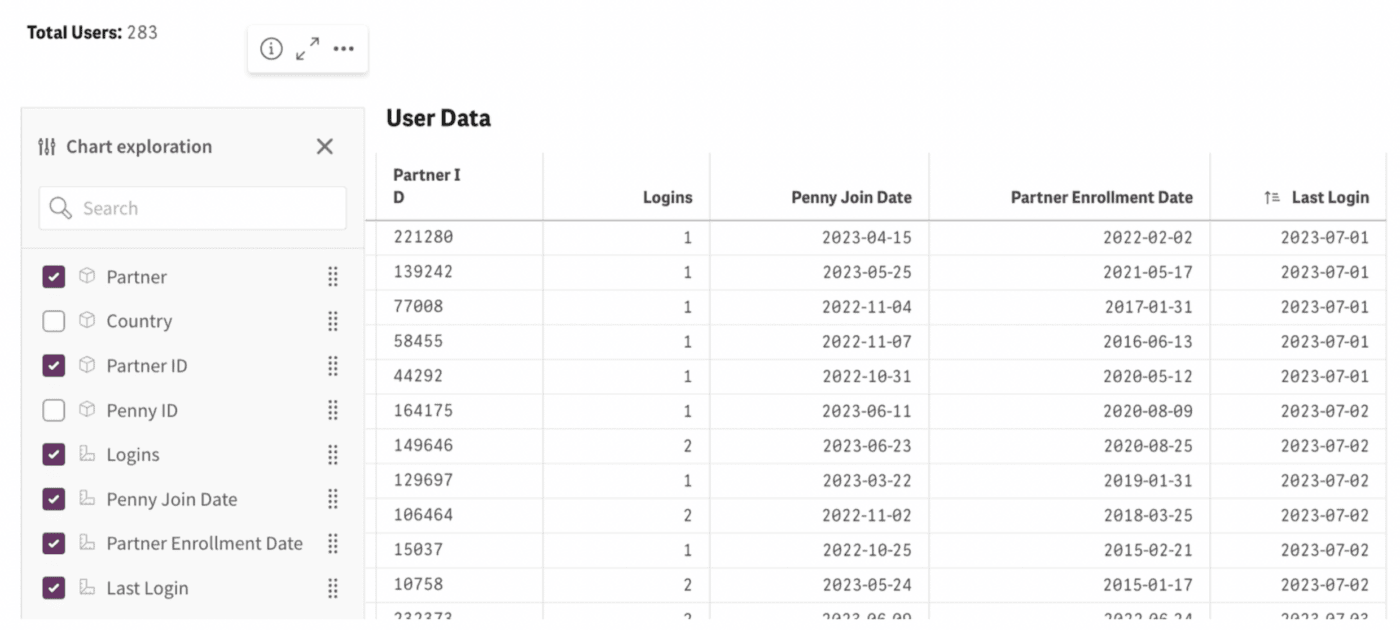
Step 1: To find the total number of people who logged in during a month, start by going to the User Summary - User-Level Data Page
Step 2: Select the period you’re looking into by changing the Login Date filter.
Step 3: You can select the different fields to breakdown the data during the period by in the Chart exploration section.
Selecting Partner ID will give you a breakdown of every individual with Logins selected shows how many times they logged in during the period.

Selecting Country, but not Partner ID will give you a breakdown of # of Logins by country during the period.

Step 4: To see the number of Users who logged in during the period by country, you can go to the Deep-Dive sheet by selecting the arrows to get to that sheet.
