Qlik FAQ
What are apps and sheets?
Qlik is made up of Apps and Sheets:
Apps are purpose-built for you. They pull in your data and tell the stories you need to understand your Penny performance.
Sheets are small sections of Qlik apps. They create visual representations of your data so you can explore, analyze, and discover data. (Sheets can be public or private.)
In Confluence, each app lives in a separate page.
- User Summary
- Activity Analysis
To find Qlik in Confluence:
- Click on ‘LOGIN TO QLIK’ to open in a new tab
- Log into Qlik (if you need help, contact your Account Manager)
- Refresh your Confluence page
- It will now appear!
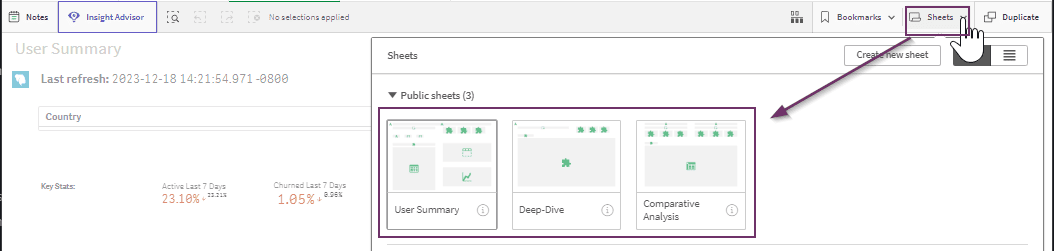
- Use the dropdown under
Sheetsto toggle between the different sheets
How do I know when the data was last refreshed?
On the default or home page of each app you can see the last time the data was refreshed.
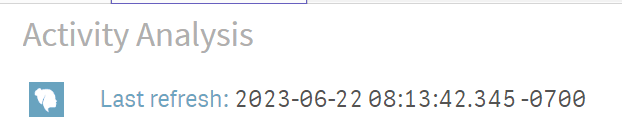
Qlik refreshes the data from Snowflake every 24 hours. We do our best to synchronize when the different tables and data sources refresh, but it’s important to know that different sections might update at different times.
To be positive that all the data has updated, wait at least 24 hours to create reports for recently completed activities.
How do I export the data to a spreadsheet (CSV or Excel file)?
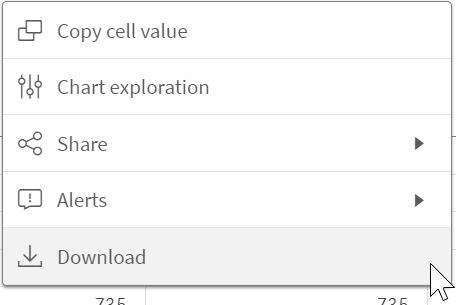
In any Qlik chart, you can right-click and select Download to export the data to a spreadsheet (CSV or Excel file).
How can I change and customize the layout of a table?
Columns can be added and reordered in a table in the Chart Explorer window, which appears to the left of the table.
I closed the box that lets me pick columns (Chart Explorer), how do I get it back?
If you have closed or don’t see the Chart Exploration box, right click, select the three dots and look for Chart Exploration.
Why does my screen look scrunched up and cut off?
The views in Qlik accommodate a wide range of screen sizes, however when windows are very small, filters and other fields may look cut off.
To resolve this:
- Open the Qlik window to full screen (the first option demonstrated in the video)
- Or reduce the zoom of your window (the second option demonstrated).
Can I filter by other fields than the basic ones on a sheet?
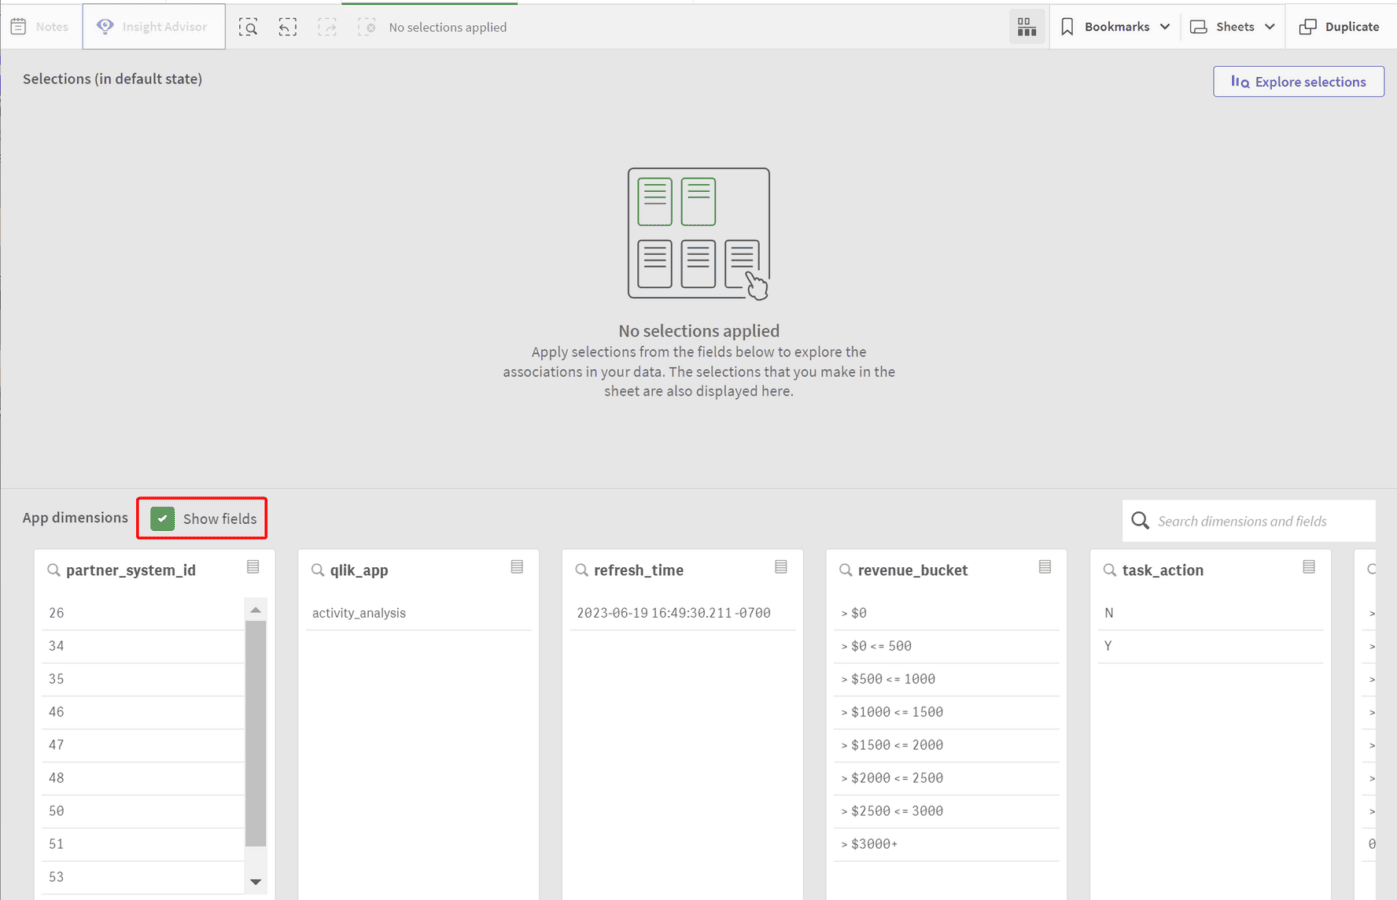
Yes! You can filter data using almost any field by using the Selections tool.
The Selections tool gives you a way, from any screen, to bring up a list of fields available for filtering in Qlik. The button, found to the left of the Bookmarks drop-down in the upper right corner of your screen brings up the tool:

Turn on App dimensions and then apply the filters you’d like!
Below is a video showing how to work with this tool:
How do I create bookmarks? (country or region-specific, for example)
Bookmarks let you save filter combinations you've created so you can quickly run the same report later on.
For example, if you regularly want to filter by all users in a particular region, such as the EMEA, you can select all of the relevant country filters and then save it as a bookmark called EMEA.
To create a new bookmark:
- Set up the filter combination you’d like to Bookmark
- Navigate to the Bookmarks drop down in the upper right corner
- Select
Create new bookmark. - Select the
Save Layoutoption as well, if you’d like to preserve your layout, including column selections and order.
How do I delete or replace an existing bookmark?
To delete a bookmark:
- Right click on the Bookmark from the
Bookmarksmenu - Select
Delete(you must be the creator of the bookmark (or an administrator))
*Before you can delete a Bookmark, you might need to Unpublish the Bookmark as well (if you’ve previously shared it)